Contents
Excel ROWS Function

When to Use the Excel ROWS Function in Excel
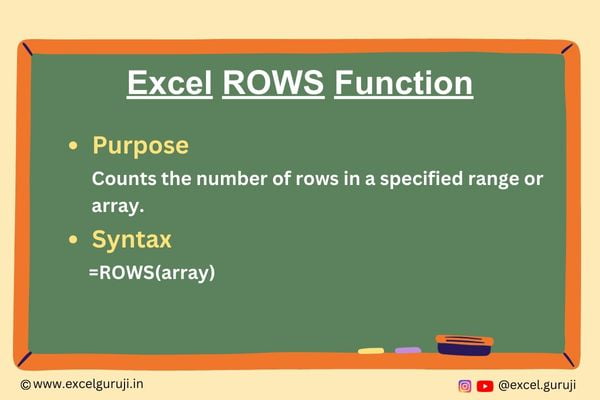
The ROWS function in Excel is a versatile tool designed to count the number of rows within a given range or an array. It finds application in various scenarios, such as data analysis, dynamic formula creation, and managing data in spreadsheets with varying row heights.
What Excel ROWS Function Returns
The Excel ROWS function returns the total number of rows within the specified range or array.
Syntax of Excel ROWS Function
The syntax of the Excel ROWS function is as follows:
=ROWS(array)
Input Arguments
Here is the input argument for the Excel ROWS function:
● array: This is the range or array for which you want to count the number of rows.
Extra Notes
● An array can represent a range, which is a selection of cells down to each other, or it can be a reference to a single group of cells.
● An array can also be a fixed set of values or an array formed by a different formula.
Examples of the Excel ROWS Function
Here are a few examples of how to use the ROWS function in Excel:

Here is an explanation of the provided formulas and their results:
- =ROWS(A4) returns 1 because it counts the number of rows in the cell A4, which includes only one cell, making it a single row.
- =ROWS(A4:A7) returns 4 because it counts the number of rows in the range A4 to A7, which includes three cells in a column, hence three rows.
- =ROWS(A4:C7) returns 4, despite the array spanning from A4 to C7, because it counts only the rows within this range, which are four.
- =ROWS(B4:B17) returns 14 because it counts the rows in the range B4 to B17, which includes 14 cells in a column, making it fourteen rows.
- =ROWS(F:F) returns 1048576. In this case, it counts the number of rows in the entire column F, which consists of 1048576 rows in an Excel worksheet.
Conclusion
In summary, the Excel ROWS function is a valuable tool for counting the number of rows in a range or array.
Whether you are working with large datasets, creating dynamic spreadsheets, or performing data analysis, the ROWS function can help you streamline your tasks and enhance your Excel skills.
As with any Excel function, mastering the ROWS function takes practice, so don’t hesitate to experiment and explore different applications of it in your own projects.
Start using the ROWS function today and take your Excel proficiency to the next level!
Frequently Asked Questions (FAQs)
Q1: Can the ROWS function be used to count columns?
A1: No, the ROWS function is specifically designed to count rows. To count columns, you should use the COLUMNS function.
Q2: Does the ROWS function consider hidden or filtered rows?
A2: Yes, the ROWS function counts all rows in the specified range or array, including hidden or filtered ones.
Q3: Can I use the ROWS function with non-rectangular1 arrays?
A3: No, the ROWS function is designed for rectangular arrays. If your data is not in a rectangular shape, you may need to use other functions or methods to achieve your desired result.
Q4: Is it possible to use cell references as the array argument in the ROWS function?
A4: Yes, you can use cell references that point to a range or array as the array argument in the ROWS function.
Other Related Excel Functions
Mastering Excel CHOOSECOLS Function: Custom Data Extraction and Analysis
Mastering Excel CHOOSEROWS Function: Select and Extract Rows Like a Pro
Maximize Data Efficiency with Excel COLUMN Function | Step-by-Step Guide
Unlocking Excel’s Potential: A Comprehensive Guide to Excel ROW Function
Join me on Instagram, YouTube and WhatApp Channel for your daily dose of valuable tips and tricks! Catch insightful videos that will enhance your knowledge and skills. Don’t miss out – follow me now!
- Non-rectangular arrays in Excel are data sets that don’t fit neatly into the usual grid of rows and columns. Normally, data in Excel is organized in a table with rows and columns, making a neat grid where each cell sits at the crossroads of a row and a column, and all rows have the same number of columns. However, non-rectangular arrays break this pattern. They can have irregular shapes, rows and columns with different lengths, or gaps. Dealing with this kind of data in Excel can be tricky because Excel is designed to work with neat grids. It is common to use custom formulas and methods to handle such data. ↩︎