Contents
Excel NPV Function

What is Net Present Value (NPV)?
Net Present Value (NPV) refers to the total value of a sequence of cash flows over the entire life of a project, discounted to its present value. Simply, NPV can be defined as the present value of expected future cash flows minus the initial investment cost:
NPV = Present Value of Future Cash Flows − Initial Investment
To delve into the mathematical aspect, let’s explore further. For a singular cash flow, the present value (PV) is calculated using the following formula:

For instance, if you wish to obtain $1100 (future value) after 1 year (time period), and your bank account offers a 10% annual interest rate (discount rate), the formula provides the answer:

In other words, $1000 is the present value of the expected $1100 to be received in the future.
Net Present Value (NPV) involves summing up the present values of all future cash flows to bring them to a single point in the present. As the term “net” signifies determining the project’s profitability after considering the initial capital investment needed to finance it, the initial investment amount is subtracted from the total sum of present values:

Where:
r – discount or interest rate
n – the number of time periods
i – the cash flow period
Since any non-zero number raised to the power of zero equals 1, the initial investment can be included in the sum. Notably, in this concise version of the NPV formula, i=0, indicating the initial investment is made in period 0.
For instance, to calculate NPV for a sequence of cash flows (600, 700, 800) discounted at 10%, with an initial cost of $1000, you can employ this formula:

How does Net Present Value aid in evaluating the financial viability of a proposed investment? The assumption is that an investment boasting a positive NPV will be profitable, while an investment with a negative NPV will be deemed unprofitable.
When to Use the Excel NPV Function in Excel
The NPV function1 in Excel is a powerful tool used for evaluating the profitability of an investment by calculating the net present value of future cash flows. It is particularly useful in financial analysis and decision-making processes, helping users assess the viability of investments or projects over time.
What Excel NPV Function Returns
The Excel NPV function returns the net present value of an investment based on a series of future cash flows and a discount rate. The result represents the difference between the present value of inflows and outflows over the investment’s time horizon.
Syntax of Excel NPV Function
The syntax of the Excel NPV function is as follows:
=NPV(rate, value1, [value2], …)
Input Arguments
Here are the input arguments for the Excel NPV function:
● rate: The discount rate used to calculate the present value of future cash flows. It is essential to ensure that the rate is consistent with the frequency of cash flows (e.g., annual rate for annual cash flows).
● value1, [value2], …: The series of future cash flows representing both inflows and outflows. These values must be provided in sequential order.
Example of the Excel NPV Function
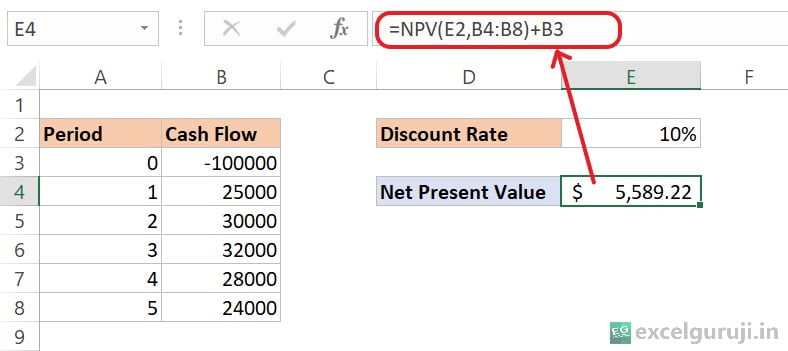
Imagine the project involves an initial investment of $100,000 and is expected to generate cash flows over the next five years. The company has chosen a discount rate of 10% to account for the time value of money and to assess the project’s profitability.
Now, the anticipated annual cash flows for the project are as follows:
- Year 1: $25,000
- Year 2: $30,000
- Year 3: $32,000
- Year 4: $28,000
- Year 5: $24,000
The company aims to calculate the Net Present Value (NPV) of this project to determine its financial soundness. The formula used for the NPV calculation is:

As the initial investment ($100000) is made today, no discounting is applied to it. We directly add this amount to the NPV result, taking into account its negative value, which effectively subtracts it.
Let’s break down the formula: =NPV(E2,B4:B8)+B3)
- NPV(E2, B4:B8): This part calculates the NPV of the cash flows in cells B4 to B8 using a discount rate of 10% (specified in cell E2). The NPV function discounts each cash flow to its present value and then sums them up.
- B3: After calculating the NPV of the cash flows, the initial investment (specified in cell B3) is added.
Therefore, the Net Present Value (NPV) of the given cash flows, with a discount rate of 10%, and considering the initial investment, is $5,589.22. This positive NPV suggests that the investment is expected to be profitable, according to the Net Present Value Rule (Which means you should only choose projects that have a positive net present value).
Extra Notes
● A positive NPV indicates a potentially profitable investment, while a negative NPV suggests a potential loss.
● Numeric arguments or functions with numerical outputs are required; any other form of input will generate an error.
● When using arrays as input, only the numerical values will be evaluated, while all other values within the array will be disregarded.
● The order of input matters when dealing with a series of cash flows.
● Ensure that the discount rate and cash flow frequencies are consistent to obtain accurate results.
● The Excel NPV function and the IRR function (Internal Rate of Return) share a close relationship. IRR represents the rate at which the NPV becomes zero.
Practice Workbook
Download Free Excel File For PracticeConclusion
In conclusion, the Excel NPV function is a valuable tool for financial analysts, investors, and decision-makers seeking to evaluate the profitability of investments. By considering the time value of money, the NPV function provides a comprehensive view of the potential returns and aids in informed decision-making.
As with any Excel function, practice and experimentation are key to mastering the NPV function. Apply it to various financial scenarios, adjust parameters, and enhance your analytical skills. Start utilizing the NPV function today to make more informed investment decisions and excel in financial analysis.
Frequently Asked Questions (FAQs)
Q1: Can the NPV function handle irregular cash flows?
A1: Yes, the NPV function is designed to handle irregular cash flows by accepting a series of values representing different cash flow amounts over time.
Q2: Is it possible to use the Excel NPV function for monthly cash flows?
A2: Yes, as long as the discount rate is adjusted accordingly. The rate should reflect the frequency of the cash flows (e.g., monthly rate for monthly cash flows).
Q3: What does a negative NPV indicate?
A3: A negative NPV suggests that the investment may not be profitable, as the present value of outflows exceeds the present value of inflows.
Q4: Can the NPV function be used for project evaluation?
A4: Yes, the NPV function is commonly used for project evaluation, helping assess the financial viability of long-term investments.
Q5: How does the Excel NPV function differ from the IRR function?
A5: While both Excel NPV function and IRR function evaluate the profitability of investments, NPV provides a monetary value, while IRR calculates the discount rate that makes the net present value zero.
Other Related Excel Functions
Excel Mastery: Unveiling the Secrets of the Excel PPMT Function for Precise Principal Payments
Join me on Instagram, YouTube and WhatApp Channel for your daily dose of valuable tips and tricks! Catch insightful videos that will enhance your knowledge and skills. Don’t miss out – follow me now!